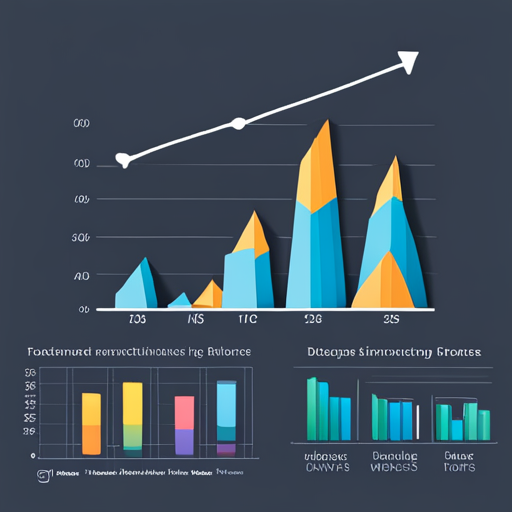
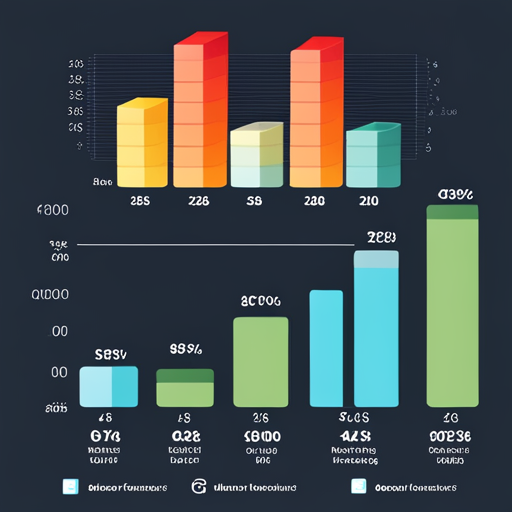
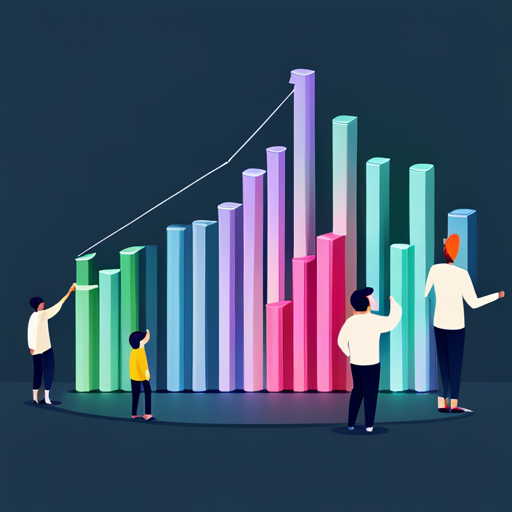
What is data visualization? It’s a powerful tool that enables the representation of complex data in a visual format, enhancing comprehension and communication of information. This is why data visualization is important: effective visuals, such as scatter plots and line graphs, can easily identify relationships and trends within the data. The clarity and accuracy of these visuals are crucial for facilitating pattern identification, supporting decision-making, and enabling data-driven storytelling. Data visualization helps in making sense of large volumes of data, and the use of data visualization tools can significantly enhance this process.
Technological advancements, particularly in cognitive computing, have significantly enhanced data visualization in recent years. Artificial intelligence (AI) and machine learning integration have enabled automated insights, improved accuracy, and efficiency, and provided intelligent decision support. Self-service data visualization tools like IBM Watson Studio and Cognos Analytics have also empowered organizations to share new insights and facilitate collaboration. Data visualization software plays a crucial role in this process, making it easier for businesses to visualize data and make informed decisions.
As data grows in complexity and volume, the need for effective data visualization becomes increasingly important. This article explores the concept of data visualization, its significance in the context of big data, and provides examples of data visualization and insights into visualization tools and software. Organizations can unlock valuable insights and make informed decisions in an increasingly data-driven world by understanding and harnessing data visualization.
Key Takeaways
- Effective visuals are crucial in displaying relationships between variables and conveying the main takeaway. Data visualization plays a key role in this.
- Simplifying visualizations by eliminating unnecessary information and using a limited number of colors enhances clarity and impact. This is a visualization best practice.
- Planning analytics, IBM Watson Studio, and Cognos Analytics are powerful data visualization tools supporting data analysis, decision-making, and visualization.
- Data visualization can potentially increase comprehension, identify patterns, enhance decision-making, and improve communication of insights. This is why data visualization is important.
Introduction
Data visualization is a powerful method of conveying information and insights through visual representations. It allows complex data to be easily understood, patterns to be identified, and decision-making to be enhanced. Which is why data visualization is important.
With the rapid growth of data in today’s digital age, data visualization has become increasingly important in various fields. It provides a means to transform raw data into meaningful and actionable knowledge. Data visualization is the graphical representation of this transformation process.
Presenting data in a visual format makes it easier to digest and interpret. This enables individuals to make informed decisions based on emerging patterns and trends. Data visualization helps in this process by making data more accessible and understandable.
Data visualization also has the potential to drive innovation and discovery by revealing hidden insights and relationships within the data. It is a tool for exploration and communication, bridging the gap between data and understanding.
Understanding Data Visualization

Visualizing information is a powerful method of representing and understanding complex datasets, allowing for identifying patterns and trends that may not be immediately apparent through other means.
Data visualization involves the visual representation of data, transforming numbers and statistics into meaningful and easily interpretable visuals. By presenting data visually, individuals can grasp the information more readily and gain deeper insights.
Visual representations of data enable us to understand data more effectively, making it easier to identify correlations, outliers, and trends. Complex datasets can be simplified and communicated concisely and impactfully through data visualization.
This futuristic approach to understanding data promotes a deeper level of engagement and comprehension, fostering a sense of belonging and enabling individuals to make data-driven decisions confidently.
The Pros and Cons of Data Visualization

One of the key advantages of employing visual representations in analyzing information is the ability to uncover hidden patterns and relationships that may not be readily apparent through other methods. Data visualization offers a unique way to present complex data sets and enables users to better understand the information at hand.
Through the use of interactive charts, graphs, and maps, data visualization allows for the exploration of data from multiple angles, facilitating the identification of trends and insights that can inform decision-making processes. Moreover, data visualization enhances communication by providing a visually appealing and engaging format for presenting findings.
However, it is important to acknowledge that data visualization also has its limitations. Over-reliance on visuals can sometimes oversimplify complex data, potentially leading to misinterpretation. Additionally, not all data can be effectively visualized, as certain types of information may require alternative analysis methods.
Overall, while data visualization offers numerous benefits in terms of uncovering hidden insights and improving communication, it is important to approach it with a critical mindset and consider its limitations.
The Importance of Data Visualization

By employing effective visual representations, complex information can be presented to enhance understanding and facilitate the identification of meaningful patterns and trends. Data visualization plays a crucial role in transforming raw data into graphical representations that can be easily comprehended.
It allows for the exploration and analysis of large datasets, enabling users to uncover hidden insights and make data-driven decisions. The importance of data visualization lies in its ability to communicate complex information in a visually appealing and accessible way.
Presenting data in a graphical format makes conveying insights and engaging audiences easier. Graphical representation allows for the effective communication of trends, comparisons, and correlations, enabling users to grasp the underlying message and make informed decisions based on the data at hand.
Data Visualization and Big Data

The analysis and representation of large datasets pose unique challenges in effectively conveying patterns and trends to facilitate data-driven decision-making. As data volume, variety, and velocity continue to grow, traditional data analysis and presentation methods become insufficient.
This is where data visualization plays a crucial role. By visually representing big data, complex information can be simplified, enabling users to easily identify patterns, trends, and correlations.
Data visualization techniques allow for exploring and discovering insights that may otherwise remain hidden in the vast sea of data. Through interactive and immersive visualizations, decision-makers can better understand their data, leading to more informed and impactful decisions.
As big data evolves, data visualization will become increasingly vital in unlocking its full potential for organizations across various industries.
Examples of Data Visualization

Examples of data visualization techniques include:
- Scatter plots that visually display relationships between variables.
- Line graphs that effectively represent time series data.
- The use of color to communicate ideas and patterns.
These techniques enhance the understanding of complex data and facilitate the identification of patterns and trends.
However, the future of data visualization goes beyond these traditional methods. With the advancement of technology and the integration of AI and machine learning, new types of data visualization are emerging. These innovative techniques enable users to explore and discover more advanced data intelligently. They provide automated insights and recommendations, improve accuracy and efficiency in data analysis, and empower users with intelligent decision support.
The future of data visualization holds immense potential to transform how we interact with and derive insights from data.
Visualization Tools and Software

As we explore the world of data visualization, it is important to understand the wide range of tools and software available to assist in this process.
Visualization tools and data visualization software have evolved significantly, empowering users to create impactful and insightful visual representations of their data. These tools offer many features and functionalities that enable users to transform complex datasets into easily understandable visuals.
From interactive dashboards to dynamic charts and graphs, these tools provide a platform for data exploration and discovery. Whether you are a beginner or an experienced data analyst, choosing the right visualization tool can greatly enhance your ability to communicate insights effectively.
Learning More About Data Visualization

Explore the vast realm of data representation and uncover the intricacies behind effectively conveying information through visuals.
To learn more about data visualization, one can delve into various resources and examples that showcase the power of visual storytelling.
By studying visualization techniques, individuals can gain insights into how to present data in a compelling and informative manner.
Numerous online platforms and courses offer in-depth knowledge on data visualization, providing individuals with the tools and skills to create impactful visuals.
One can witness the transformative potential of visualizing complex information from data visualization examples in fields like finance, healthcare, and marketing.
Continue Learning What is Data Visualization and Its Significance in Today’s Business Landscape with Us
data visualization is not just a fancy buzzword; it’s a transformative tool that can turn complex data into actionable insights. It’s a compass guiding you through the vast ocean of data, helping you navigate and make sense of the information that matters most to your business. But, like any tool, its effectiveness depends on how well it’s wielded.
That’s where ZZ Servers steps in. We’re not just experts in IT infrastructure and cybersecurity; we’re also adept at harnessing the power of data visualization. Our team can help you implement effective data visualization strategies, using top-tier data visualization tools, to transform your raw data into a treasure trove of insights.
Imagine being able to see your data come alive, telling a story that drives your decision-making process. Picture yourself identifying trends and patterns that were previously hidden in the depths of spreadsheets. That’s the power of data visualization, and it’s a power that ZZ Servers can help you harness.
But don’t just take our word for it. Reach out to us and let’s explore how we can turn your data into a strategic asset. Whether you’re grappling with big data, seeking to enhance your business intelligence, or looking to visualize your data in a way that drives your business forward, ZZ Servers is here to help.
Remember, data is only as valuable as the insights you can extract from it. So why not let ZZ Servers guide you on this journey of discovery? Contact us today to learn more about how our data visualization services can illuminate your path to success.
In the world of data, seeing is understanding. Let ZZ Servers help you see your data in a whole new light.


